|
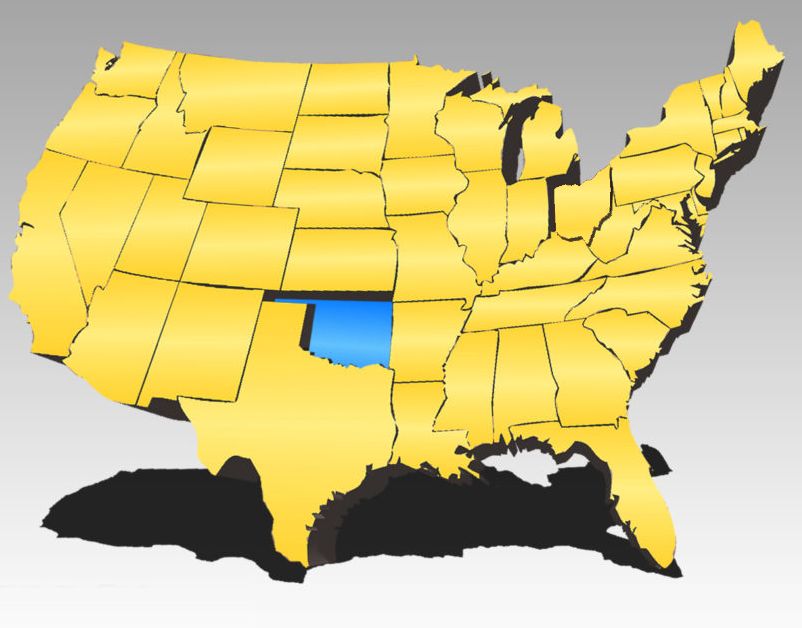
Jonathan Williams recently published a detailed report on several fiscal comparisons of the 50 states, pertaining to tax policy & business-friendly environments. Oklahoma ranked in the top 3 when it comes to property taxes. Texas, by comparison, scored miserably on the same criteria.
But in other parts of the charts, Texas devastated Oklahoma's legacy by not imposing an income tax on citizens. All in all, Texas ranked 2nd in the nation for 'Economic Performance'. Oklahoma came in 20th. This is part of the picture which might explain why Oklahoma's population trend is shrinking, compared to the national picture. Texas is growing robustly, despite their property tax oppressions. The Bad News..
Of the several economic comparisons, Oklahoma scores an aggregate 20th. Texas ranks 2nd. For this and other reasons, Oklahomans are still leaving the state at levels comparable to California.
|
|
|
Jonathan Williams is an economist working with ALEC. He posted the following thoughts on economic policy and the impact which it will have on population shifts; and eventually the makeup of the 2022 congress and electoral colleges to follow.
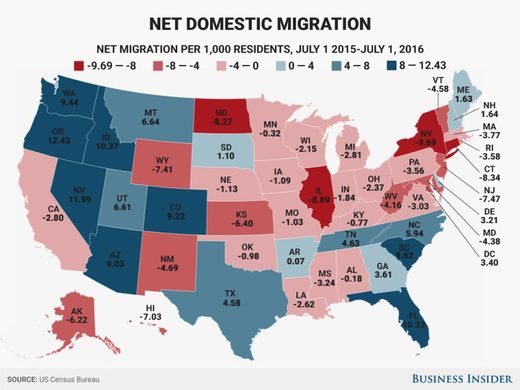
In general, states that keep taxes low and provide a competitive business climate perform far better than the states that follow the tax-and-spend approach.
In terms of overall population changes over the past year, that finding is once again confirmed. The United States has grown to nearly 327 million residents, with highly competitive economies in Idaho, Nevada and Utah leading the way this past year in percentage growth. It is important to note that overall population growth takes into account several factors, including: birth rates and death rates, international immigration and domestic migration. This data provides a key barometer for policymakers as states compete for the Americans who continue to "vote with their feet" and move from state to state for greater economic opportunity. At least once a decade, the political class in Washington pays close attention to these state population flows, as the numbers will alter the makeup of congressional seats during the once-in-a-decade process of reapportionment and redistricting. Seats in the U.S. House of Representatives are apportioned based on the total number of residents within a state. In addition, congressional apportionment affects the Electoral College, which could swing future, close presidential elections. There are several methods that the firm, Election Data Services, uses when attempting to estimate which states will be the big winners and losers of the 2020 Census. The new 2017 Census estimates can be used to give us a year-over-year change from 2016 or, alternatively, estimates can be based on a longer-trend line. |
Current Economic Outlook (2019)From the 2019 edition of Rich States, Poor States. These values are the most recent available at the time of publication.
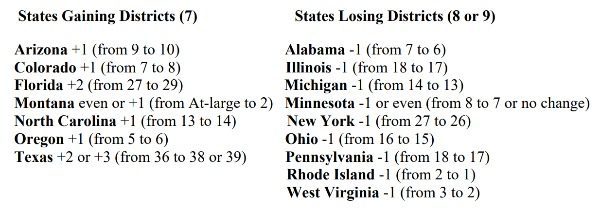
The data gives a nice summary of estimates for congressional seat changes after the 2020 Census.
|